صانع الإنفوجرافيك بالذكاء الاصطناعي: أنشئ إنفوجرافيك مجّانيّة في دقائق
أنشئ إنفوجرافيك مخصّصة بسرعة مع أفضل صانع إنفوجرافيك بالذكاء الاصطناعي من Pixazo. جرّبه مجّانًا!
ابدأ الآن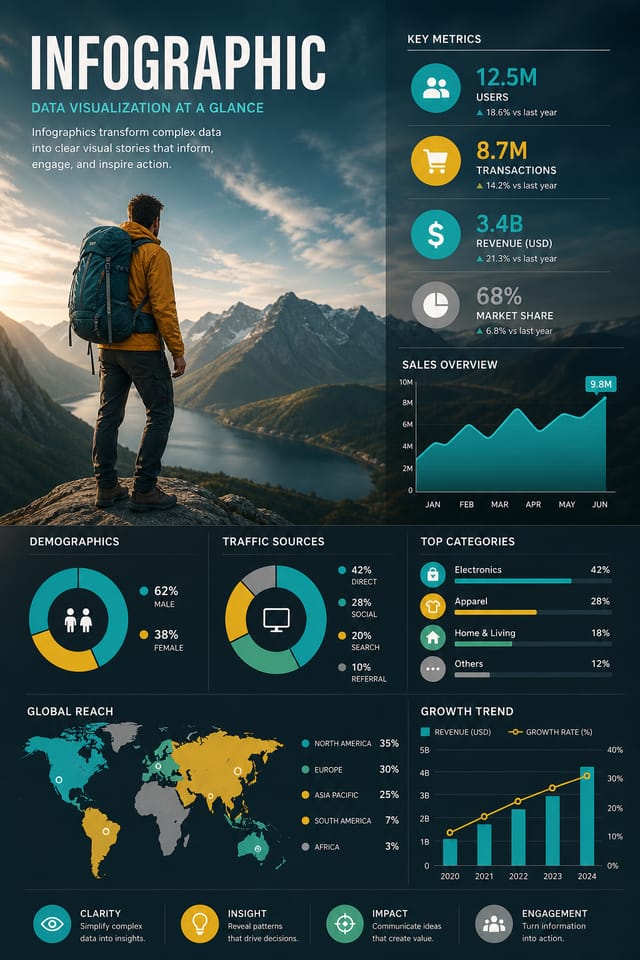
إنفوجرافيك مدعوم بالذكاء الاصطناعيّ: من الفكرة إلى الواقع
اصنع إنفوجرافيك بشخصيّة بصريّة حقيقيّة. يختار الذكاء الاصطناعيّ عناصر التصميم التي تلائم جماليّات الإنفوجرافيك، لا قوالب عامّة.
صُمم للمصمّمين والمسوّقين وأصحاب الأعمال الصغيرة والمبدعين الذين يحتاجون إلى تصاميم إنفوجرافيك احترافيّة بلا برامج تصميم.
أنشئ إنفوجرافيكك مجّانًاكيف يترجم الذكاء الاصطناعيّ أسلوب الإنفوجرافيك: ولماذا يُهمّ
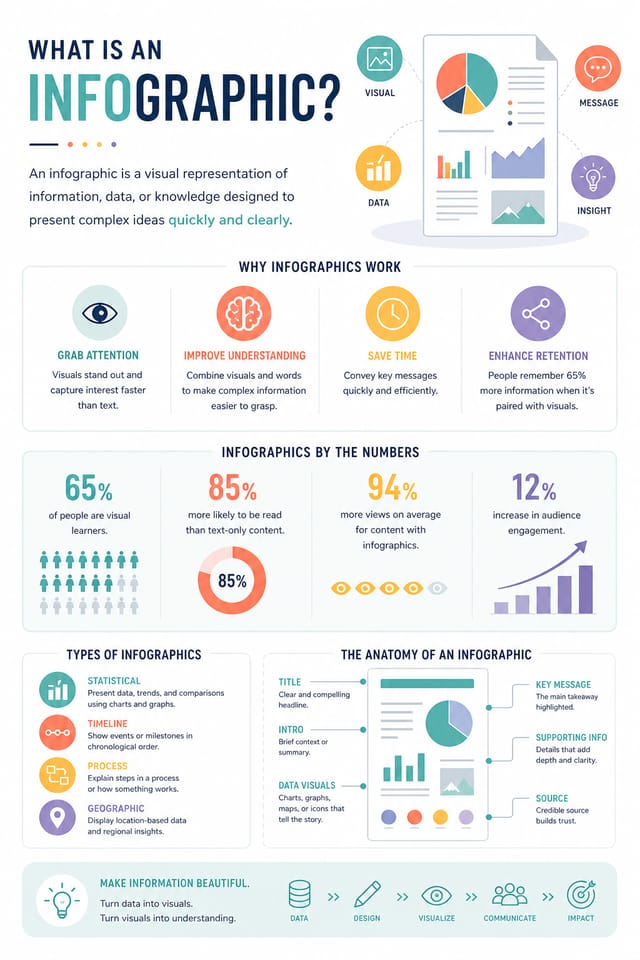
منطق تصميم الإنفوجرافيك
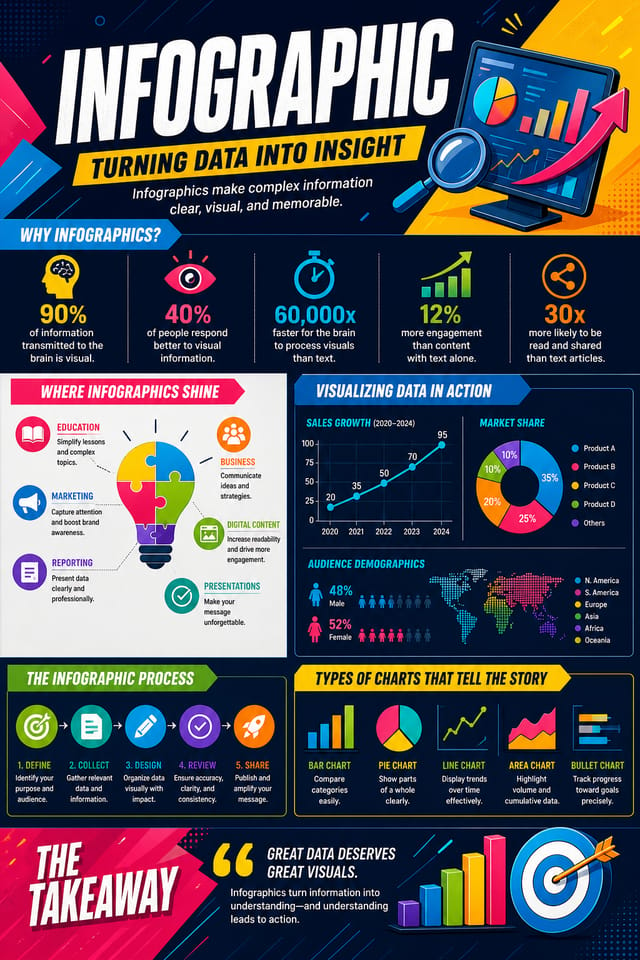
يتجاوز تصميم الإنفوجرافيك الاحترافيّ مجرّد تطبيق فلتر ألوان على تخطيط عامّ.
تشمل اللغة البصريّة لتصميم الإنفوجرافيك مقاربات تركيبيّة مميّزة، وتآلفات لونيّة مخصوصة، واختيارات طباعيّة تدلّ على الجودة والقصد.
عندما تستخدم Pixazo لإنشاء إنفوجرافيك، يطبّق الذكاء الاصطناعيّ هذه المعرفة البصريّة على طلبك المحدّد.
تأتي النتيجة مدروسة ومناسبة للأسلوب، لا عشوائية ولا مشتقّة من قالب جاهز.
عمليّة إنفوجرافيكك: تفصيل سير العمل
الموجز تحديد المتطلبات
حدّد الرسالة الأساسيّة والمقاسات وتفضيلات الألوان والجمهور المستهدف لبطاقتك قبل أيّ عمل تصميميّ.
بحث جمع المراجع
اجمع أمثلة لتصاميم إنفوجرافيك فعّالة، ولاحظ ما ينجح، وحدّد الأنماط المرتبطة بأهداف مشروعك.
تصدير تسليم الملفات النهائية
صدِّر إنفوجرافيكك بالصِيغ والدقّات المطلوبة. نظّم المخرجات لتسليمها إلى فريق الإنتاج أو النشر.
تحسين صقل التصميم
طبّق تعديلات موجَّهة على بطاقتك المختارة. اضبط الخطّ والتباعد واللون حتّى يطابق كلّ عنصر معاييرك.
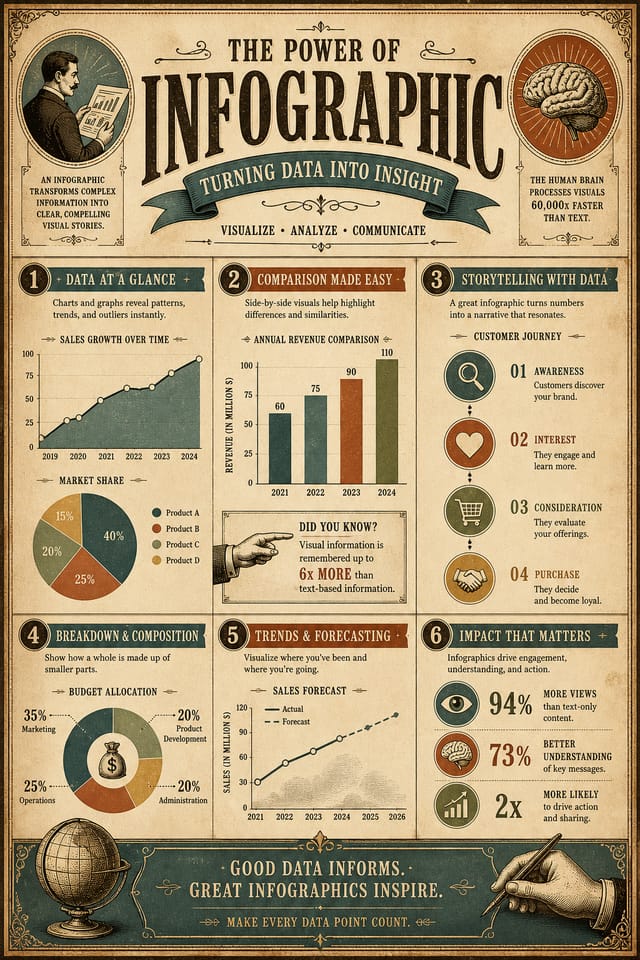
ما الذي يميّز الإنفوجرافيك القويّ: أساسيّات التصميم
إرشادات تصميم الإنفوجرافيك: قواعد تستحقّ الاتّباع
استخدم تسلسلًا بصريًا متّسقًا
هيكِل إنفوجرافيكك بحيث تتبع عين المشاهد مسارًا واضحًا من العنوان إلى التفاصيل الداعمة وصولًا إلى الدعوة إلى الإجراء.
حافظ على تركيز الرسالة
الإنفوجرافيك القويّ يُبلّغ بفكرة أساسيّة واحدة بوضوح. ينبغي للتفاصيل الداعمة أن تعزِّز الرسالة الرئيسيّة، لا أن تنافسها.
حافظ على اتساق العلامة
حافظ على اتّساق تصميم الإنفوجرافيك مع ألوان علامتك التجاريّة الحاليّة، وخطوطها، ولغتها البصريّة لهويّة متماسكة.
الاعتماد كليًا على مخرجات الذكاء الاصطناعي
تصاميم الإنفوجرافيك المُولَّدة بالذكاء الاصطناعيّ هي نقطة انطلاق. المراجعة البشريّة تكتشف مشكلات في السياق والنبرة والدقّة قد يفوت الذكاء الاصطناعيّ ملاحظتها.
تجاهل إمكانية الوصول
النصّ منخفض التباين وأحجام الخطوط الصغيرة جدًّا في إنفوجرافيكك تُقصي شريحة كبيرة من جمهورك المحتمل.
إغفال الدعوة إلى الإجراء
الإنفوجرافيك الذي يخلو من خطوة تالية واضحة للمشاهد فرصة ضائعة. أدرِج دائمًا توجيهًا بشأن ما يجب فعله بعد ذلك.
ازدحام التخطيط
ملء كلّ بكسل من إنفوجرافيكك بالمحتوى يجعله أصعب قراءةً ويُقلِّل من تأثير كلّ عنصر على حدة.
إمكانيات صانع الإنفوجرافيك: ما يستطيع فعله
التحكّم في الدقّة
حدِّد أبعاد الإخراج لإنفوجرافيكك. احصل على ملفّات بأحجام مناسبة للعرض على الويب، أو وسائل التواصل الاجتماعيّ، أو الطباعة بصِيغ كبيرة.
إنتاج مُطابِق للأسلوب
يفسّر الذكاء الاصطناعيّ اتّفاقيّات تصميم الإنفوجرافيك ويطبّقها على بطاقتك، فيُنتج عملًا بأسلوب صحيح بدل قالب عامّ.
تطبيق الأسلوب بطبقات
ادمج أسلوب الإنفوجرافيك مع معايير تصميم أخرى في موجّه واحد. يفسّر الذكاء الاصطناعيّ الطلبات المعقّدة ويطبّق قيود أسلوب متعدّدة في آن واحد.
مخرجات جاهزة للطباعة
الإنفوجرافيك المُنشأ بأحجام وهيكليّة مناسبة للطباعة الاحترافيّة. حمِّل ملفّات عالية الدقّة جاهزة للإنتاج.
خيارات وضع النصّ
وصِف أين ترغب بوضع عناصر النصّ في بطاقتك. يتبع الذكاء الاصطناعيّ توجيهات التركيب بشأن موضع العنوان وتخطيط النصّ الأساسيّ.
البنية التركيبية
تعكس قرارات التخطيط والتسلسل الهرميّ أنماط تصميم الإنفوجرافيك. تتطابق التناسبات والترتيب مع الطريقة التي تُهيكَل بها تصاميم الإنفوجرافيك عرفًا.
موجّهات بداية فعّالة للإنفوجرافيك
انسخ أيّ مطالبة أدناه والصقها في Pixazo لإنشاء تصميمك فورًا.
تصميم إنفوجرافيك متوافق مع السلسلة، لغة بصريّة تمتدّ إلى صِيَغ متعدّدة، نظام تصميم متّسق عبر التنويعاتتصميم إنفوجرافيك نظيف، بنية هندسيّة، طباعة منضبطة، استخدام انتقائيّ للون التمييز للتأكيد، دقّة محسَّنة للطباعةإنفوجرافيك عالي التأثير، قراءة بصريّة فوريّة بحجم المصغّرة، هيمنة عنوان واضحة، معلومات داعمة مهيكلة منطقيًّاإنفوجرافيك احترافيّ، مقاربة إنفوجرافيك تقليليّة، فضاء سالب مستخدم بقصد، قابل للقراءة من مسافات مشاهدة متعدّدة، تركيب جاهز للطباعةإنفوجرافيك مُحسَّن، علاقات لونيّة راقية، مساحة بيضاء مقصودة، خطوط ملائمة لأسلوب الإنفوجرافيك، تركيب متوازنإنفوجرافيك بملء الكادر، معالجة الخلفيّة تمتدّ إلى الحوافّ، عناصر المقدّمة مُموضَعة لتحقيق توازن تركيبيّ، تسلسل هرميّ مركزيّ قويّمقارنة أدوات الإنفوجرافيك: مقارنة بين الأدوات
Canva
محرّر بالسحب والإفلات مع مكتبة قوالب ضخمة وميزات تعاونية.
Desygner
أداة تصميم متعدّدة الصِيغ مع تحرير PDF وإدارة العلامة.
Pixazo
مولّد إنفوجرافيك مدعوم بالذكاء الاصطناعيّ بتصميم قائم على الموجّه وجودة إخراج احترافيّة
Piktochart
صانع إنفوجرافيك وعروض تقديميّة لمرئيّات مبنيّة على البيانات
VistaCreate
منصّة محتوى مرئي مع قوالب ومكتبة أصول مدمجة.
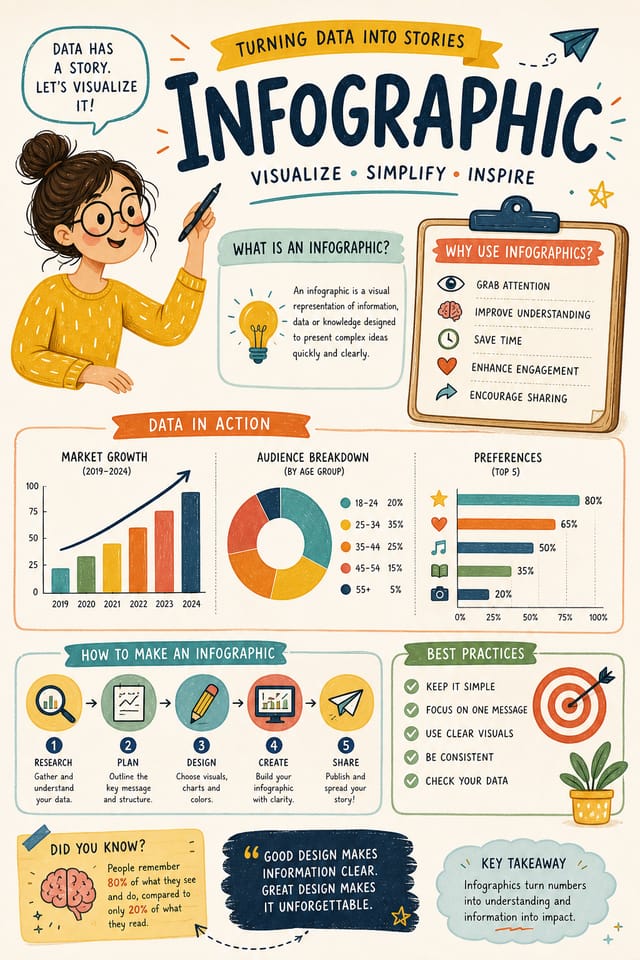
خطوات تصميم الإنفوجرافيك: ثلاث خطوات سهلة
عبِّر عن الهدف
ابدأ بوصف نصّيّ لمفهوم إنفوجرافيكك. حدِّد الأسلوب البصريّ، والألوان، واتّجاه التخطيط، والنصّ الرئيسيّ. الموجّهات المفصَّلة تُنتج تصاميم إنفوجرافيك أدقّ من العامّة منها.
تصفّح إنتاج الذكاء الاصطناعيّ
تُنشئ Pixazo بطاقتك في ثوانٍ. راجِع التصميم وعدّل المطالبة لصقل عناصر محدّدة: غيّر لوحة الألوان، أو أعِد توزيع وزن التخطيط، أو أضِف العناصر البصريّة التي تريدها.
سلِّم الملفّ
احصل على ملفّ بطاقتك النهائيّ بنقرة واحدة. اختر الصيغة وحمّل بدقّة كاملة واستخدم التصميم على الفور. بلا علامة مائيّة وبلا رسوم إضافيّة وبلا انتظار.
شاهد: إنشاء تصاميم الإنفوجرافيك خطوة بخطوة
من يُنشئ الإنفوجرافيك: من يستخدمه
لوحات الإلهام والموجزات الإبداعيّة
أنشئ إنفوجرافيكات تجمع المراجع البصريّة، ولوحات الألوان، وعيّنات الملمس في لوحات ملهِمة. صمِّم أدوات تواصل للفرق الإبداعيّة.
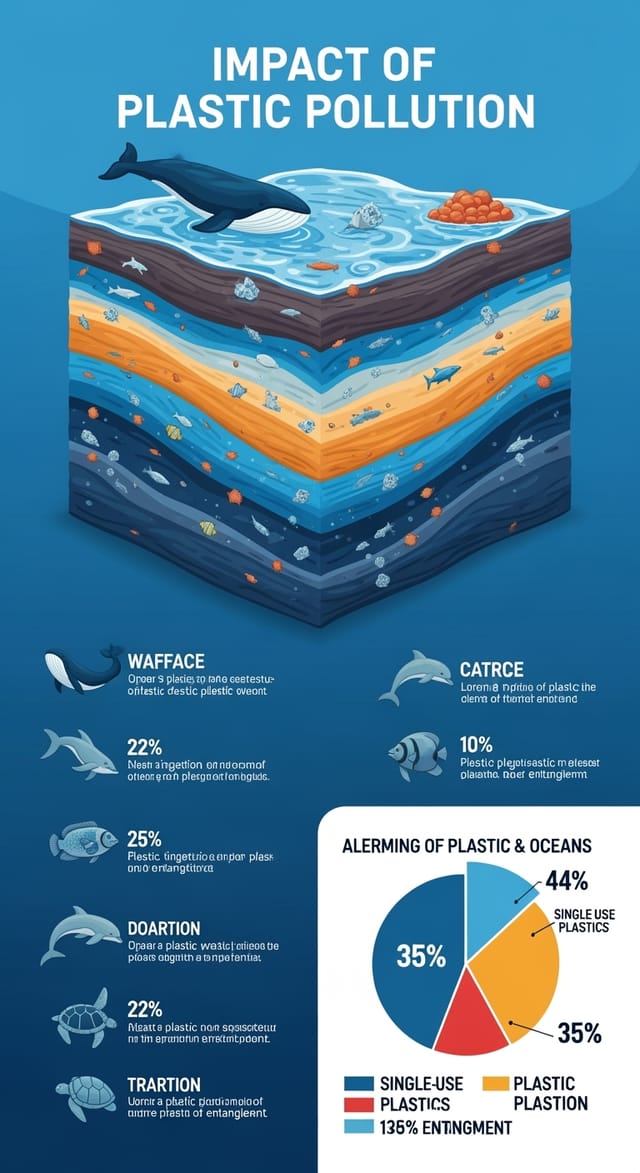
إنفوجرافيك مبنيّ على البيانات
أنشئ إنفوجرافيكات تحوّل الإحصائيّات ونتائج الأبحاث إلى سرديّات بصريّة. تصاميم تجعل البيانات المعقّدة في متناول الجميع وقابلة للمشاركة.
الجداول الزمنيّة التاريخيّة وللمشاريع
أنشئ إنفوجرافيكات ترسم خرائط الأحداث والمحطّات وأطوار المشروع على امتداد خطّ زمنيّ بصريّ. تصاميم تجعل التسلسل الزمنيّ بديهيًّا بلمحة واحدة.
كولاجات الصور والمونتاجات
صمِّم إنفوجرافيكات ترتّب صورًا متعدّدة ضمن تراكيب بصريّة متماسكة. تخطيطات شبكيّة وحرّة لسرد القصص بالصور.
الهياكل التنظيميّة والتسلسلات الهرميّة
أنشئ إنفوجرافيكات تُصوِّر هياكل الفرق، وخطوط التبعيّة، والتنظيم الإداريّ. تخطيطات احترافيّة تُوضّح العلاقات التنظيميّة المعقّدة.
تنويعات التصميم للإنفوجرافيك: اعثر على مظهرك
إنفوجرافيك عالي التباين
معالجة بصريّة جريئة للإنفوجرافيك بتباين تدرّجيّ قويّ. تُقرأ العناصر بوضوح من أيّ مسافة مشاهدة.
إنفوجرافيك بملمس
تصميم إنفوجرافيك بعمق سطحيّ إضافيّ. تُضيف معالجات الخلفيّة اهتمامًا بصريًّا دون الإخلال بسهولة القراءة.
إنفوجرافيك هندسيّ
تركيب إنفوجرافيك مُهيكَل باستخدام أنظمة الشبكات والأشكال الزوايا. الترتيب والدقّة يُعرِّفان المقاربة البصريّة.
إنفوجرافيك تقليليّ
مقاربة إنفوجرافيك مُقتصِدة. عناصر أقلّ، فضاء سالب أوسع، والطباعة تحمل ثقلًا بصريًّا أكبر.
تصميم الإنفوجرافيك: ما يسأل عنه الناس
صِف معايير التصميم الأساسيّة في كلّ موجّه وغيِّر فقط العناصر المحدّدة التي ينبغي أن تتبدّل عبر السلسلة. إنّ المحافظة على لوحة ألوان متّسقة، ونهج طباعيّ موحَّد، وبنية تركيبيّة ثابتة عبر تنويعات الإنفوجرافيك يُنتج سلسلة متماسكة.
تُنشَأ الإنفوجرافيك خلال ثوانٍ بعد إرسال موجزك. عادةً ما يكون مجموع الوقت من إرسال المطالبة إلى الملف القابل للتنزيل أقلّ من دقيقة، بما في ذلك معالجة الخادم.
التصاميم المُنشأة باستخدام Pixazo متاحة للاستخدام التجاريّ. يمكنك استخدام إنفوجرافيكك لمشاريع العملاء، ومبيعات المنتجات، والإعلانات، وسائر التطبيقات التجاريّة دون رسوم ترخيص إضافيّة.
يمكنك طلب لوحات ألوان عالية التباين أو ملائمة لمن يعانون عمى الألوان داخل موجّهك. حدِّد 'لوحة ألوان متاحة' أو 'ألوان آمنة لعمى الألوان من نوع deuteranopia'، وسيختار الذكاء الاصطناعيّ ألوانًا مناسبة للإنفوجرافيك تحافظ على تباين كافٍ للمستخدمين ذوي القصور في رؤية الألوان.
من داخل مجتمع الإنفوجرافيك: أعمال حقيقيّة من المبدعين
مبدعون حقيقيّون يشاركون إنفوجرافيكهم المُصمَّمة بـ Pixazo AI.
إنفوجرافيك مُصمَّم للعرض في الوضع الداكن، خلفيّة سوداء محسَّنة لشاشات OLED، ألوان تمييز نابضة، نصّ عالي التباين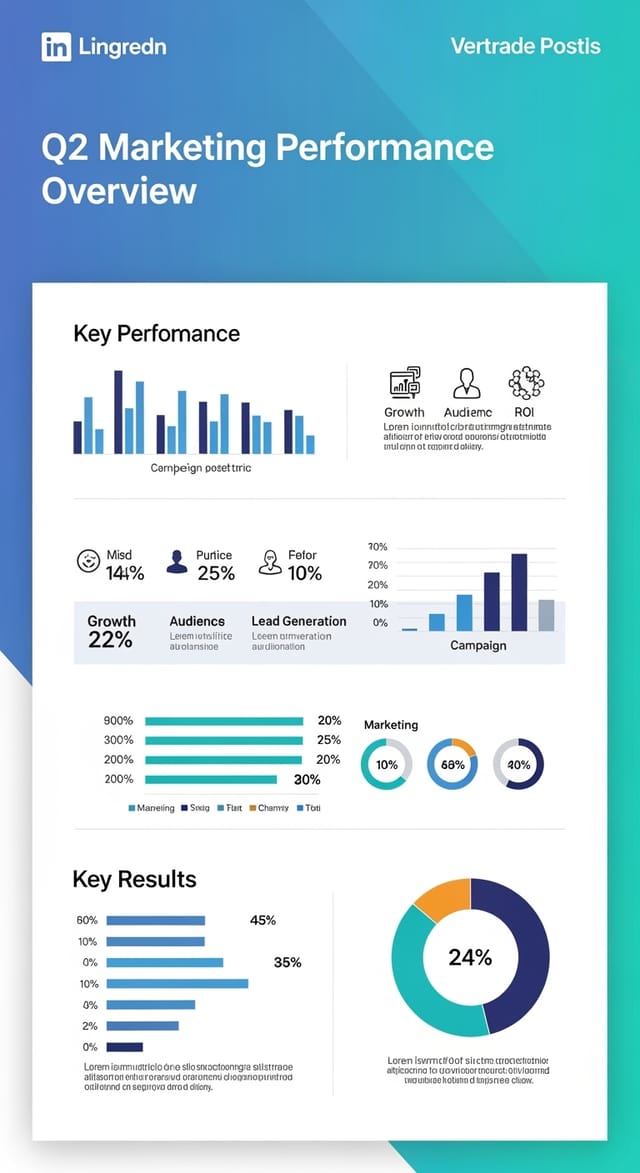
إنفوجرافيك ثنائيّ اللون، أقصى تباين بين اللون الأساسيّ والثانويّ، الطباعة مضبوطة بلون واحد لكلّ مستوى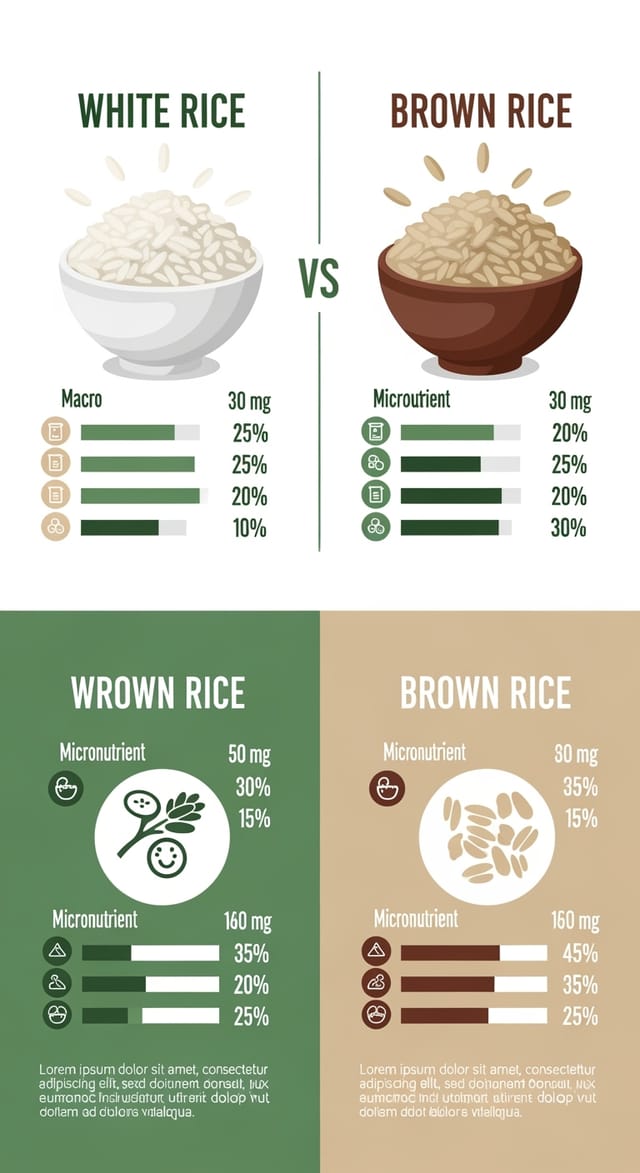
إنفوجرافيك بموضوع صديق للبيئة، درجات أخضر طبيعيّ وكرافت، أشكال عضويّة، رسائل استدامة، جماليّات صناعة يدويّةحدود الذكاء الاصطناعيّ في الإنفوجرافيك: توقّعات واقعيّة
القيود والمقايضات المعروفة لتصميم الإنفوجرافيك المُولَّد بالذكاء الاصطناعيّ. التحديد الدقيق لما يستطيع توليد إنفوجرافيك الذكاء الاصطناعيّ القيام به وما لا يستطيع يساعدك على تخطيط سير عملك ووضع توقّعات دقيقة.

