Créateur d’infographies IA : créez des infographies gratuites en quelques minutes
Créez rapidement des infographies personnalisées avec le meilleur créateur d’infographies IA de Pixazo. Essayez gratuitement !
Commencer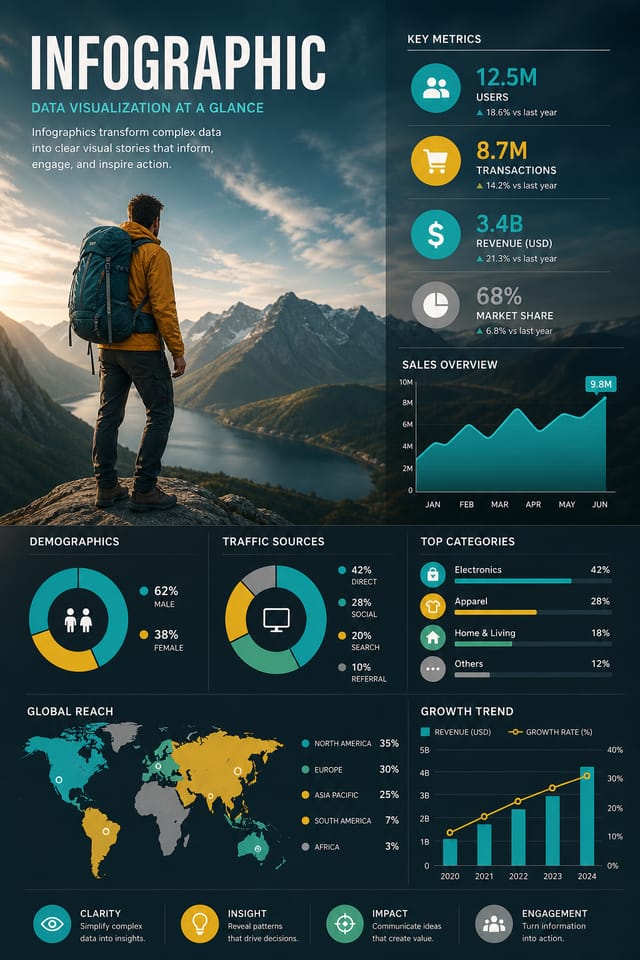
Infographie propulsée par l’IA : de l’idée à la réalité
Créez des infographies avec une véritable personnalité visuelle. L’IA sélectionne des éléments de design adaptés à l’esthétique de l’infographie, et non des modèles génériques.
Conçu pour les designers, les marketeurs, les dirigeants de petites entreprises et les créateurs qui ont besoin de designs d’infographie professionnels sans logiciel de design.
Créez votre infographie gratuitementComment l’IA traduit le style d’infographie : pourquoi c’est important
La logique du design d’infographie
Le design professionnel d’infographie ne se limite pas à appliquer un filtre de couleur à une mise en page générique.
Le langage visuel du design d’infographie englobe des approches compositionnelles distinctives, des affinités chromatiques caractéristiques et des choix typographiques qui signalent qualité et intention.
Lorsque vous utilisez Pixazo pour créer une infographie, l’IA applique ces connaissances visuelles à votre demande spécifique.
Le résultat paraît délibéré et en phase avec le style, ni accidentel ni dérivé d’un modèle.
Votre processus d’infographie : décomposition du flux de travail
Brief Définir les exigences
Définissez le message-clé, les dimensions, les préférences de couleur et le public cible de votre infographie avant tout travail de design.
Recherche Rassembler des références
Rassemblez des exemples d’infographies efficaces, notez ce qui marche et identifiez les schémas pertinents pour vos objectifs.
Exporter Livrer les fichiers finaux
Exportez votre infographie dans les formats et résolutions requis. Organisez les livrables pour le transfert à l’équipe de production ou de publication.
Affiner Affinez le design
Appliquez des éditions ciblées à l’infographie choisie. Ajustez typographie, espacement et couleur jusqu’à ce que chaque élément réponde à votre standard.
Ce qui distingue les infographies fortes : fondamentaux du design
Conseils de design d’infographie : règles à suivre
Adoptez une hiérarchie visuelle cohérente
Structurez votre infographie de sorte que l’œil du spectateur suive un chemin clair, du titre aux détails de soutien jusqu’à l’appel à l’action.
Restez concentré sur le message
Une infographie forte communique clairement une idée principale. Les détails de soutien doivent renforcer le message principal, pas entrer en concurrence avec lui.
Préservez l’alignement de la marque
Maintenez la cohérence du design de votre infographie avec les couleurs, polices et langage visuel existants de la marque pour une identité cohérente.
Se reposer uniquement sur le résultat de l’IA
Les designs d’infographie générés par IA constituent un point de départ. La relecture humaine détecte les problèmes de contexte, de ton et de précision que l’IA peut manquer.
Ignorer l’accessibilité
Le texte à faible contraste et les tailles de police minuscules dans votre infographie excluent une part importante de votre audience potentielle.
Oublier l’appel à l’action
Une infographie sans étape suivante claire pour le spectateur est une occasion manquée. Indiquez toujours la marche à suivre.
Surcharger la mise en page
Remplir chaque pixel de votre infographie de contenu la rend plus difficile à lire et réduit l’impact de chaque élément individuel.
Capacités du créateur d’infographies : ce qu’il peut faire
Contrôle de la résolution
Précisez les dimensions de sortie de votre infographie. Obtenez des fichiers dimensionnés pour l’affichage web, les réseaux sociaux ou l’impression grand format.
Génération fidèle au style
L’IA interprète les conventions de design d’infographie et les applique à la vôtre, produisant un résultat correctement stylé plutôt qu’un modèle générique.
Application de style par couches
Combinez le style d’infographie avec d’autres paramètres de design dans un seul prompt. L’IA interprète les demandes complexes et applique simultanément plusieurs contraintes de style.
Résultat prêt à imprimer
Les infographies générées sont dimensionnées et structurées pour l’impression professionnelle. Téléchargez des fichiers haute résolution prêts pour la production.
Options de placement du texte
Indiquez où placer les éléments de texte sur votre infographie. L’IA suit les directives de composition sur le placement du titre et la mise en page du corps de texte.
Structure compositionnelle
Les décisions de mise en page et de hiérarchie reflètent les schémas de design d’infographie. Les proportions et l’agencement correspondent à la manière dont les designs d’infographie sont conventionnellement structurés.
Prompts de démarrage d’infographie qui fonctionnent
Copiez n’importe quel prompt ci-dessous et collez-le dans Pixazo pour générer votre design instantanément.
Design d’infographie compatible avec une série, langage visuel s’étendant à plusieurs formats, système de design cohérent entre les variantesDesign d’infographie épuré, structure géométrique, typographie disciplinée, accent de couleur utilisé sélectivement pour l’emphase, résolution optimisée pour l’impressionInfographie à fort impact, lecture visuelle immédiate à la taille d’une vignette, dominance claire du titre, informations de soutien structurées logiquementInfographie professionnelle, approche minimaliste, espace négatif utilisé intentionnellement, lisible à plusieurs distances de visualisation, composition prête à imprimerInfographie affinée, relations chromatiques sophistiquées, espaces blancs intentionnels, polices appropriées au style d’infographie, composition équilibréeInfographie à fond perdu, traitement d’arrière-plan s’étendant jusqu’aux bords, éléments de premier plan positionnés pour l’équilibre compositionnel, hiérarchie centrale forteComparaison des outils d’infographie : outils comparés
Canva
Éditeur glisser-déposer avec une vaste bibliothèque de modèles et des fonctionnalités de collaboration.
Desygner
Outil de design multi-formats avec édition PDF et gestion de marque.
Pixazo
Générateur d’infographies propulsé par l’IA avec design basé sur des prompts et qualité de sortie professionnelle
Piktochart
Créateur d’infographies et de présentations pour des visuels pilotés par les données
VistaCreate
Plateforme de contenu visuel avec modèles et bibliothèque d’assets intégrée.
Étapes de design d’infographie : trois étapes faciles
Communiquez l’objectif
Commencez par une description textuelle de votre concept d’infographie. Précisez le style visuel, les couleurs, l’orientation de la mise en page et le texte clé. Les prompts détaillés produisent des designs d’infographie plus précis que les prompts généraux.
Parcourez la génération IA
Pixazo génère votre infographie en quelques secondes. Examinez le design et ajustez votre prompt pour affiner des éléments précis : changez la palette, redistribuez le poids de la mise en page ou ajoutez des éléments visuels.
Transmettez le fichier
Obtenez votre fichier final en un clic. Choisissez le format, téléchargez en pleine résolution et utilisez le design immédiatement. Pas de filigrane, pas de frais, pas d’attente.
À regarder : créer des designs d’infographie étape par étape
Qui crée des infographies : qui les utilise
Planches d’ambiance et briefs créatifs
Générez des infographies rassemblant des références visuelles, des palettes de couleurs et des échantillons de texture sur des planches inspirantes. Concevez des outils de communication pour les équipes créatives.
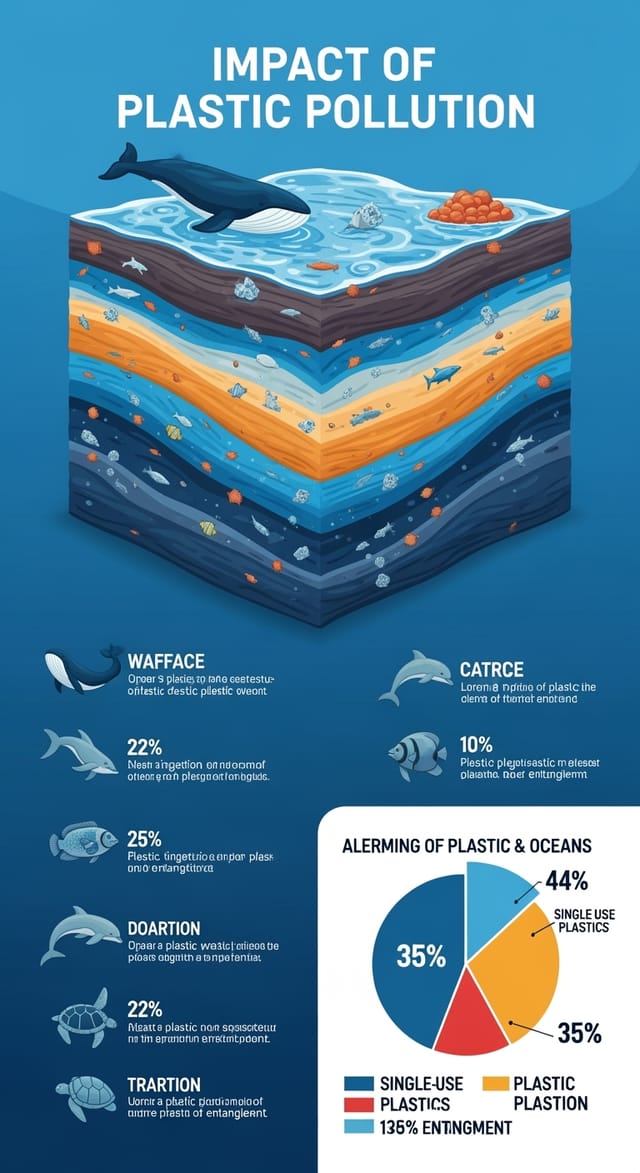
Infographies pilotées par les données
Créez des infographies qui transforment statistiques et résultats de recherche en récits visuels. Des designs qui rendent les données complexes accessibles et partageables.
Chronologies historiques et de projet
Générez des infographies qui cartographient événements, jalons et phases de projet le long d’une chronologie visuelle. Des designs qui rendent la chronologie intuitive au premier coup d’œil.
Collages et montages photo
Concevez des infographies qui agencent plusieurs images en compositions visuelles cohérentes. Mises en page en grille ou libres pour la narration photographique.
Organigrammes et hiérarchies
Créez des infographies visualisant les structures d’équipe, les lignes hiérarchiques et l’organisation par service. Des mises en page professionnelles qui clarifient les relations organisationnelles complexes.
Variations de design pour les infographies : trouvez votre style
Infographie à fort contraste
Traitement visuel audacieux pour l’infographie avec un contraste tonal marqué. Les éléments se lisent clairement à toute distance de visualisation.
Infographie texturée
Design d’infographie avec une profondeur de surface ajoutée. Les traitements d’arrière-plan ajoutent de l’intérêt visuel sans nuire à la lisibilité.
Infographie géométrique
Composition d’infographie structurée utilisant des systèmes de grille et des formes angulaires. L’ordre et la précision définissent l’approche visuelle.
Infographie minimaliste
Approche épurée de l’infographie. Moins d’éléments, plus d’espace négatif, la typographie porte davantage de poids visuel.
Design d’infographie : les questions fréquentes
Décrivez vos paramètres de design fondamentaux dans chaque prompt et ne faites varier que les éléments spécifiques qui doivent changer d’une infographie à l’autre. Maintenir une palette de couleurs, une approche typographique et une structure compositionnelle cohérentes entre les variations crée une série homogène.
Une infographie se génère en quelques secondes après l’envoi du prompt. Du prompt au fichier téléchargeable, le temps total est généralement inférieur à une minute, traitement serveur compris.
Les designs créés avec Pixazo sont disponibles pour un usage commercial. Vous pouvez utiliser vos infographies pour des projets clients, la vente de produits, la publicité et d’autres applications commerciales, sans frais de licence supplémentaires.
Vous pouvez demander des palettes à fort contraste ou adaptées au daltonisme dans votre prompt. Précisez « palette de couleurs accessible » ou « couleurs sûres pour la deutéranopie » et l’IA sélectionnera des couleurs adaptées à l’infographie qui maintiennent un contraste suffisant pour les utilisateurs présentant des déficiences de vision des couleurs.
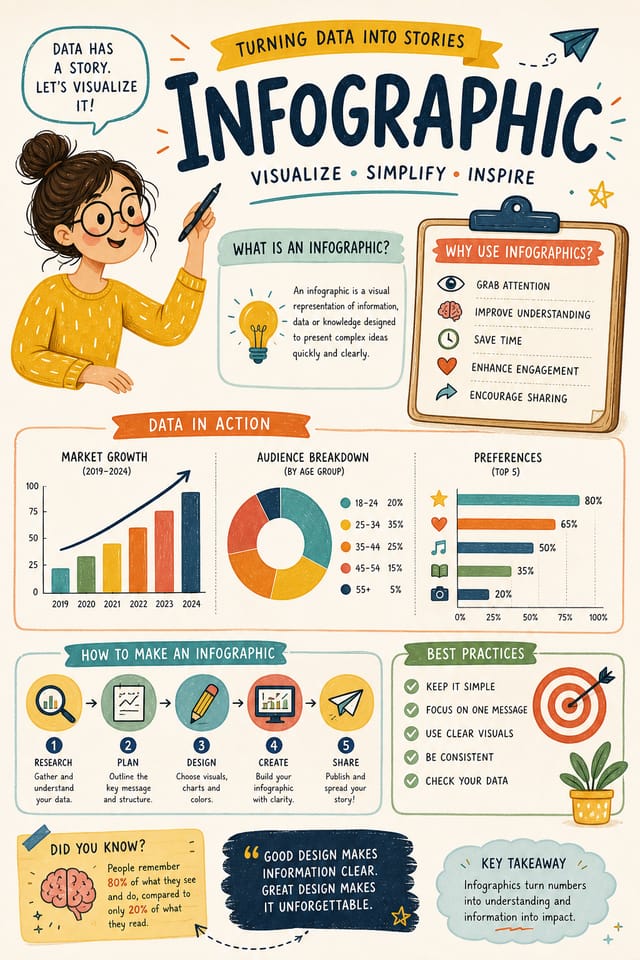
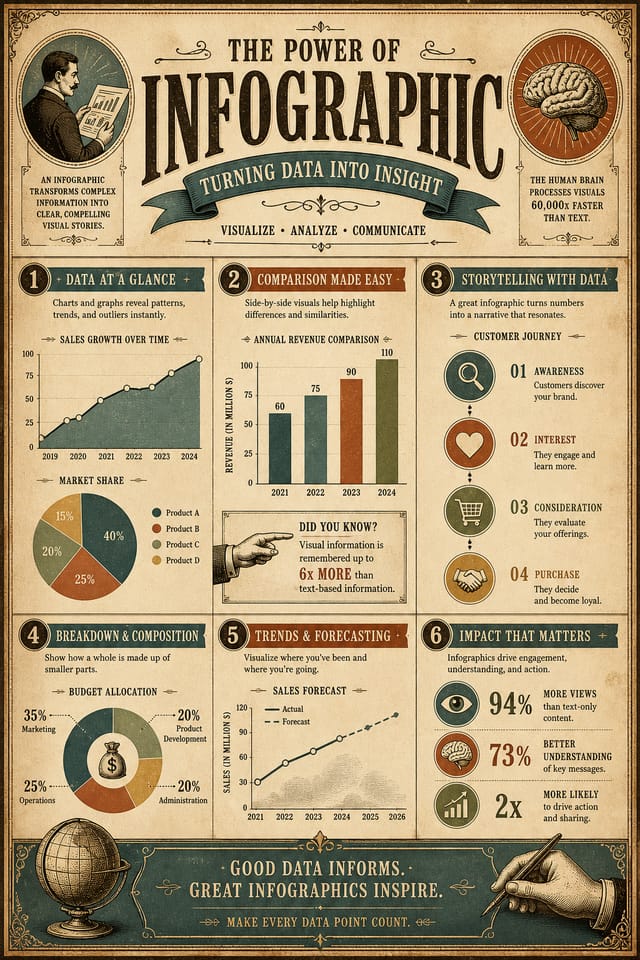
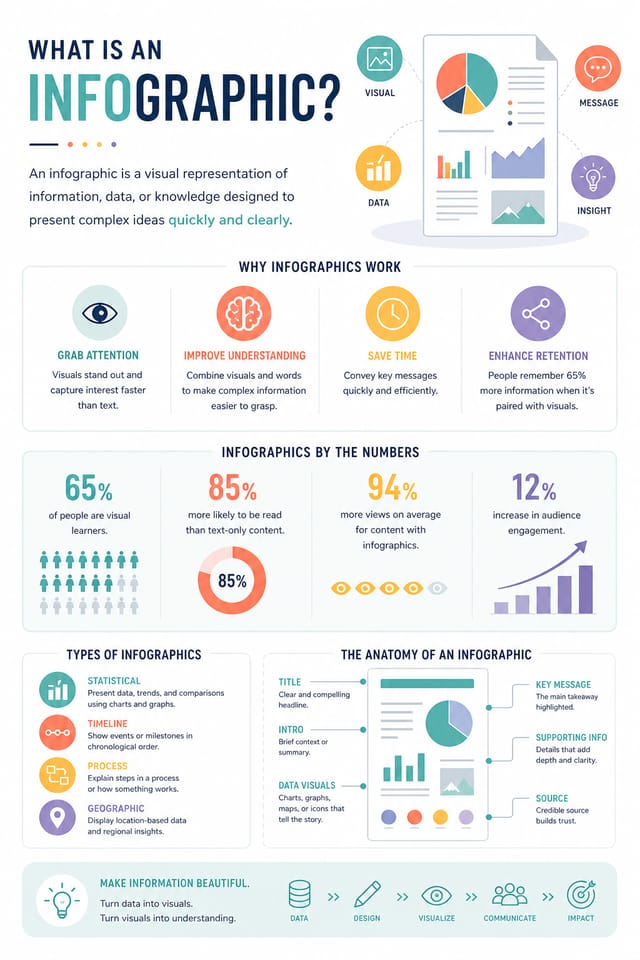
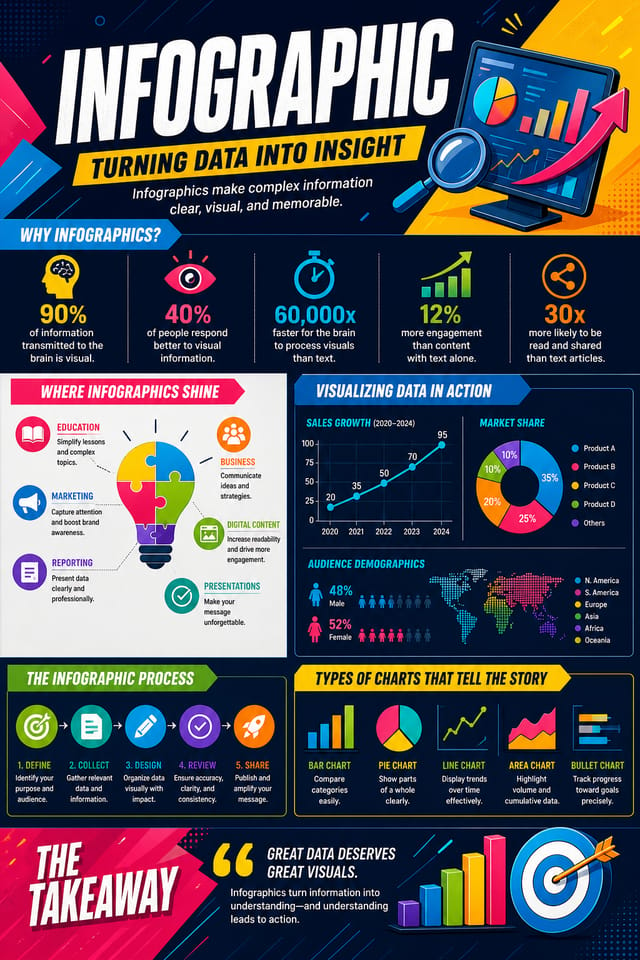
Au cœur de la communauté Infographie : du vrai travail de créateurs
De vrais créateurs partagent leurs infographies faites avec Pixazo AI.
Infographie conçue pour un affichage en mode sombre, fond noir optimisé OLED, couleurs d’accent vibrantes, texte à fort contraste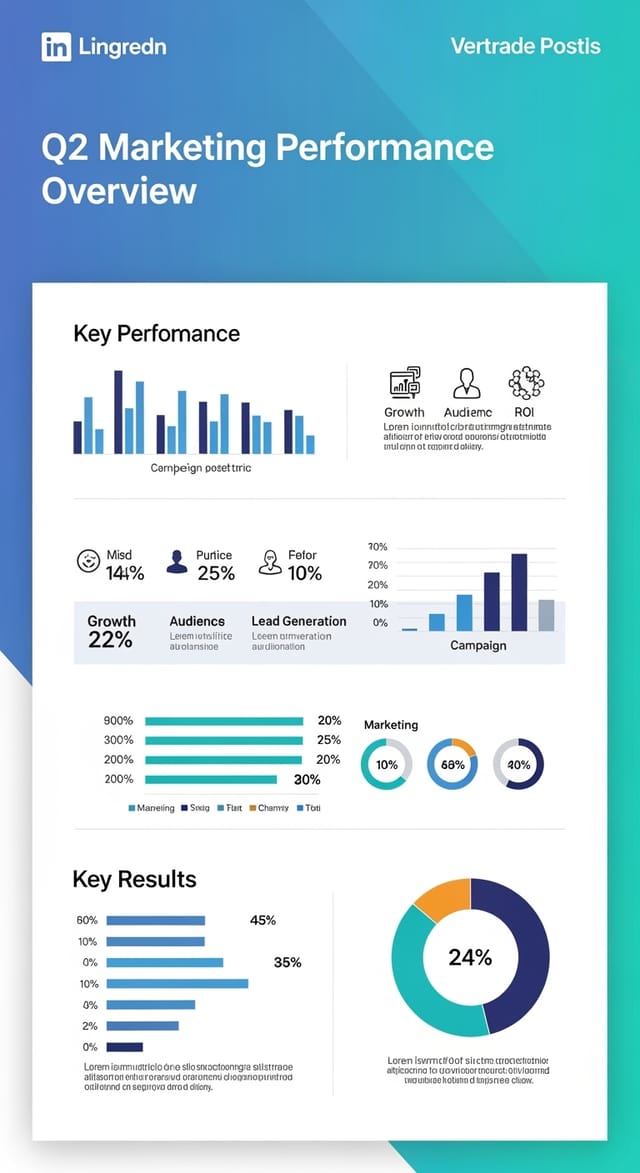
Infographie bichromique, contraste maximal entre couleur primaire et couleur secondaire, typographie réglée sur une couleur par niveau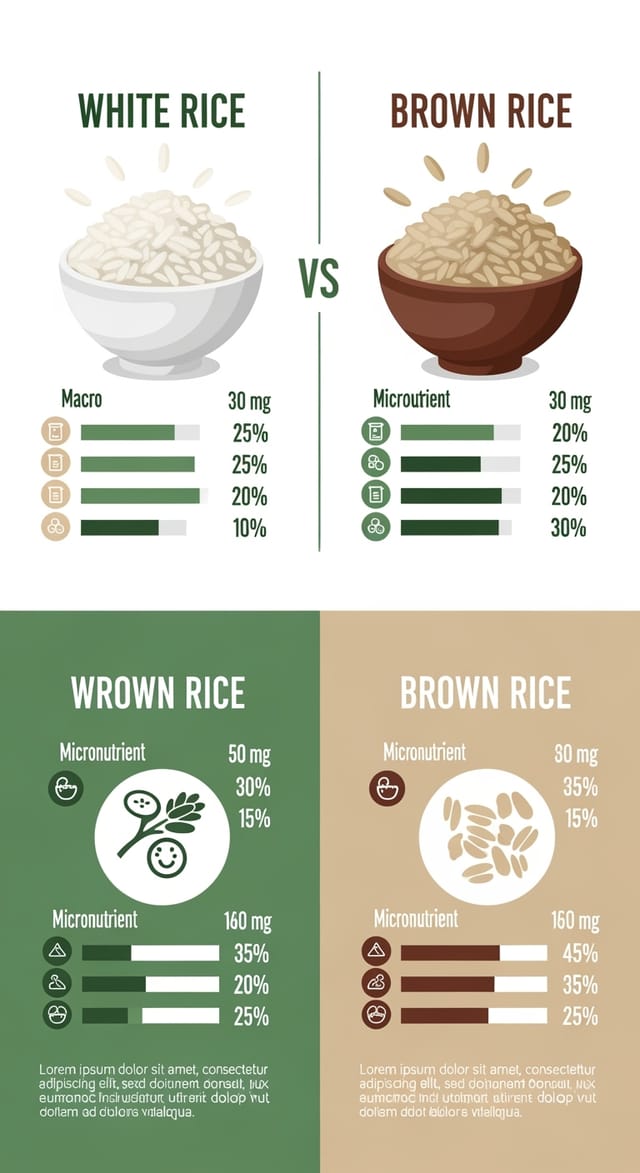
Infographie sur le thème éco-responsable, tons vert naturel et kraft, formes organiques, message de durabilité, esthétique artisanaleLimites de l’IA pour l’infographie : attentes réalistes
Limitations et compromis connus du design d’infographie généré par IA. Être précis sur ce que la génération d’infographies par IA peut et ne peut pas faire vous aide à planifier votre flux de travail et à définir des attentes justes.

