Business Infographic : Create Free Business Infographics in Minutes with AI
Create Custom Business Infographics Quickly with Pixazo Best AI Business Infographic Maker. Try for Free!
Get Started
The Business Infographic Framework: Design Intelligence at Work
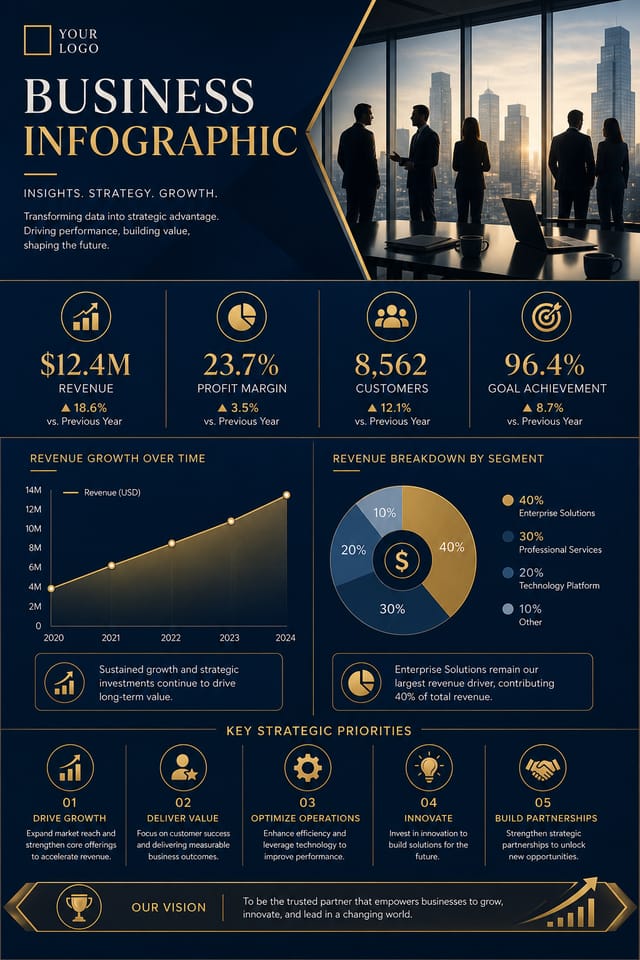
The Business Infographic Design Framework
Not all infographic design styles work the same way.
Business design has specific characteristics that distinguish it from other approaches: particular color affinities, compositional tendencies, and typographic conventions that trained designers recognize immediately.
Pixazo applies this style knowledge automatically.
When you request a business infographic, the AI pulls from a visual vocabulary appropriate to business design, producing output that reads correctly to anyone familiar with the style.
The Business Infographic Process: Behind the Scenes
Draft the Concept
Start with a text description of your business infographic concept. Specify the visual style, colors, layout direction, and key text. Detailed prompts produce more accurate business infographic designs than general ones.
Verify the Design
The AI produces a business infographic based on your description. If the first result isn't exactly right, adjust the prompt to address what needs changing. Most designs reach the target within a few iterations.
Wrap the Project
Download your completed business infographic in the format that fits your use case. High-resolution files for print, web-optimized versions for digital, or PDF for production-ready delivery.
Watch: Creating Business Infographic designs step by step
Delivering Your Business Infographic: Export Options Explained
Print-ready format for business infographic files that preserves fonts, colors, and layout across different devices and print services.
JPG
Compressed image format suited for business infographic designs with photographic elements where smaller file size matters more than pixel-perfect edges.
SVG
Scalable format for business infographic designs that need to render crisply at any resolution, commonly used for web and responsive layouts.
WEBP
Modern web format offering smaller file sizes than PNG or JPG for business infographic images without significant quality loss.
PNG
Lossless image format ideal for business infographic designs with transparency, sharp text, and web display at predictable file sizes.
Business Infographics Across Fields: Where They Fit
Recruitment and Hiring Outreach
Generate business infographics for job fairs, career pages, and employer branding initiatives. Designs that represent company culture visually.
Internal Communications
Create business infographics for all-hands meetings, policy announcements, and employee recognition programs. Professional materials for internal audiences.
Product Launch Campaigns
Design business infographics for new product introductions across digital and print channels. Materials that establish positioning from day one.
Client and Investor Presentations
Design business infographics that support pitch decks, quarterly reviews, and stakeholder updates. Visual summaries that communicate key metrics.
Built for Business Infographic: Capabilities Explained
Compositional Structure
Layout and hierarchy decisions reflect business design patterns. The proportions and arrangement match how business designs are conventionally structured.
Fast Generation
Complete business infographic designs generate in seconds. No rendering queues, no waiting for batch processing.
Text Placement Options
Describe where you want text elements positioned in your business infographic. The AI follows compositional direction about headline placement and body copy layout.
Prompt Refinement
Adjust your description to refine any aspect of the business infographic design. The AI responds to specific direction about colors, layout, or content.
Consistency Across Variants
Generate multiple business infographics for a project and maintain visual consistency across the set. Specify your core design parameters and vary secondary elements.
Context-Aware Design
Describe your business infographic's purpose and audience. The AI adjusts visual weight, complexity, and clarity based on the intended use context.
Design Standards for Business Infographic: Best Practices
Sample Business Infographic Prompt Templates
Copy any prompt below and paste it into Pixazo to generate your design instantly.
Full-bleed business infographic, background treatment extends to edges, foreground elements positioned for compositional balance, strong central hierarchyBusiness aesthetic infographic, palette drawn from business design tradition, layout proportions consistent with business conventions, purposeful use of each elementLarge-format business infographic design, elements sized for visibility at print scale, no fine detail that would be lost in productionBusiness infographic with strong visual hierarchy, largest element reads clearly, supporting elements organized by importance, clean background treatmentMonochromatic business infographic, single-hue palette with value variation for contrast, typographic hierarchy creates visual interest without color complexityHigh-impact business infographic, immediate visual read at thumbnail size, clear headline dominance, supporting information structured logicallyWhat Business Infographic AI: Areas for Improvement
Known limitations and trade-offs of AI-generated business design. Every AI design tool has boundaries. Knowing these limits before you start helps you get the most out of business infographic generation.
Current Business Infographic Directions: Current Directions
Motion-Ready Design
Static business infographic designs are being created with animation in mind, using layered elements that translate smoothly to motion graphics.
Hand-Drawn Elements
Illustrations, doodles, and hand-lettering bring a personal, approachable quality to business infographic designs in an era of polished digital output.
Retro Revival
Vintage aesthetics from the 1970s and 1990s are influencing business infographic design with textured backgrounds, serif fonts, and warm gradients.
Data-Driven Visuals
Incorporating charts, statistics, and structured data directly into business infographic layouts helps communicate complex messages at a glance.
From the Business Community: A Design Gallery
Real creators sharing their business designs made with Pixazo AI.
Business infographic with retro 1970s color palette, warm oranges and browns, groovy display type, textured paper background feel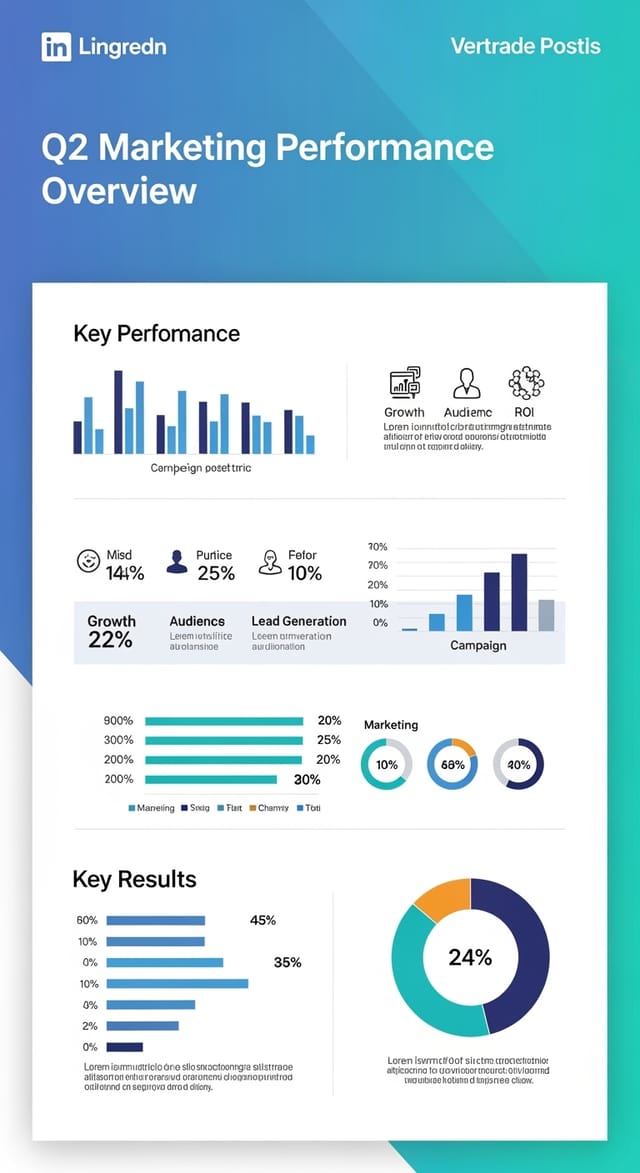
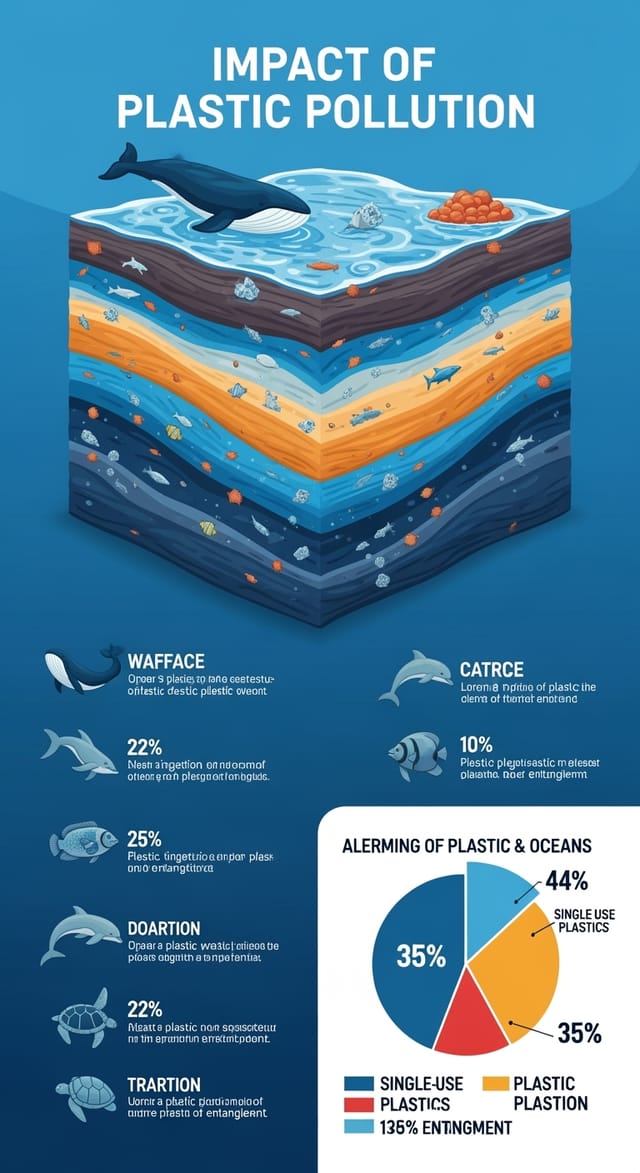
Eco-friendly themed business infographic, natural green and kraft tones, organic shapes, sustainability messaging, handcrafted aesthetic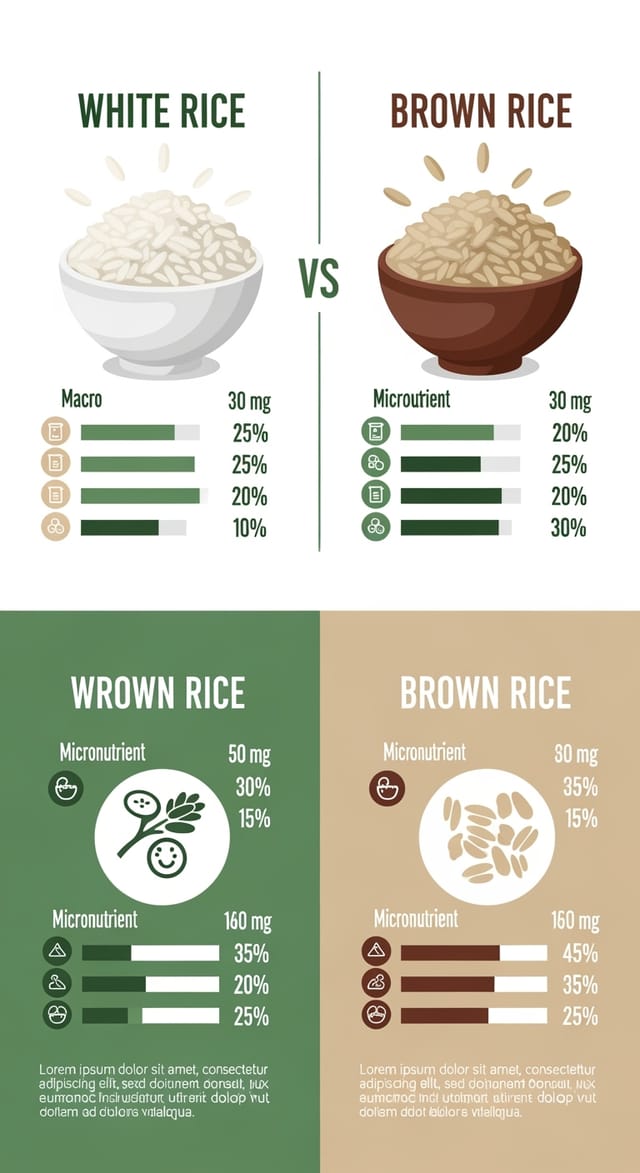
A3 landscape business infographic for conference booth, informational layout with three columns, clear section headers, QR code placement zoneCreating Business Infographics: Questions and Answers
You can generate as many variations as your account tier allows. Refine your prompt with each iteration to move toward your target design. Most users find the right direction within three to five generations.
Generate your initial business infographic, review the output, then modify your prompt to adjust specific elements. Each regeneration produces a fresh design incorporating your changes. Most users reach their final business infographic design within two to four iterations.
Brand kits let you save your logo, fonts, and color palette so every business infographic you generate stays on brand. Once configured, the AI applies your brand parameters automatically alongside business style conventions.
The AI renders text as specified in your prompt, so double-check spelling and punctuation before generating. If text renders incorrectly in a business infographic, adjust your prompt and regenerate. The AI follows your exact text input.
Longer, more detailed prompts generally produce more accurate results for business infographic design. Include all the relevant information: style direction, color preferences, content to display, intended use, and any specific design elements you want. There is no strict character limit.

