Real Estate Infographic : Create Free Real Estate Infographics in Minutes with AI
Create Custom Real Estate Infographics Quickly with Pixazo Best AI Real Estate Infographic Maker. Try for Free!
Get Started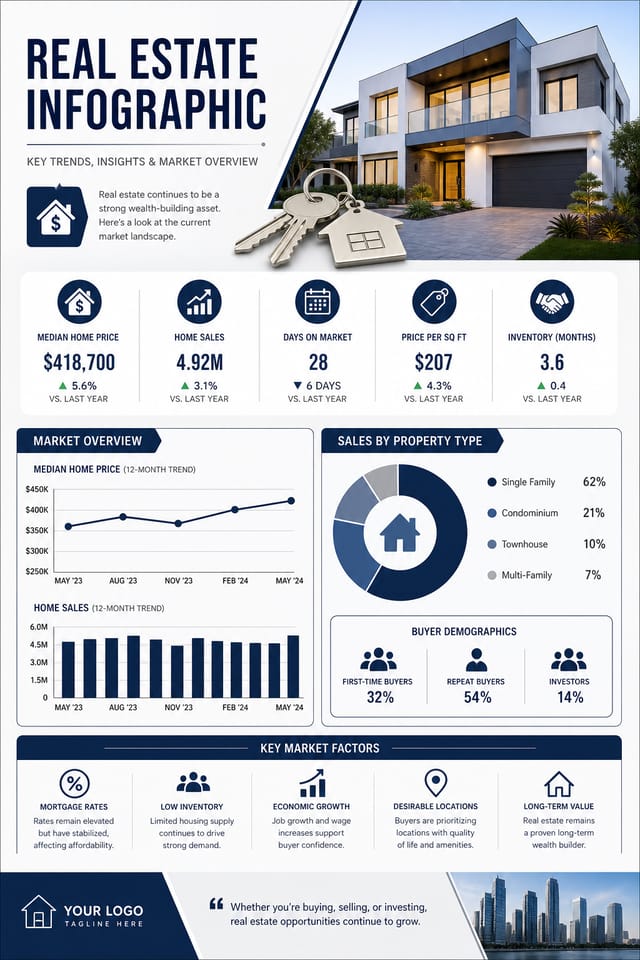
Visual Thinking Behind Real-Estate Infographics: Key Design Conventions
How Pixazo Reads Real-Estate Style Cues
The gap between a professional real-estate infographic and a mediocre one usually comes down to design decisions made early in the process: palette selection, type hierarchy, and compositional structure.
These choices determine whether the final output reads as real-estate or just looks generic.
Pixazo's AI makes these foundational decisions based on your prompt.
Specify a real-estate infographic and the system selects design parameters that match real-estate visual expectations, giving you a solid starting point rather than a blank-slate template.
Real-Estate Infographic Export Guide: Choosing the Right Format
JPG
Compressed image format suited for real-estate infographic designs with photographic elements where smaller file size matters more than pixel-perfect edges.
Print-ready format for real-estate infographic files that preserves fonts, colors, and layout across different devices and print services.
WEBP
Modern web format offering smaller file sizes than PNG or JPG for real-estate infographic images without significant quality loss.
PNG
Lossless image format ideal for real-estate infographic designs with transparency, sharp text, and web display at predictable file sizes.
SVG
Scalable format for real-estate infographic designs that need to render crisply at any resolution, commonly used for web and responsive layouts.
Real-Estate Infographic Design Quality: Design Fundamentals
How People Use Real-Estate Infographics: Practical Examples
Content Creation Workflow
Incorporate real-estate infographic generation into a content production workflow. Fast output enables higher publishing frequency.
Event Promotion
Create real-estate event infographics that establish the right visual mood before the event. Real-Estate design signals quality and sets expectations.
Small Business Marketing
Produce real-estate marketing infographics without a design agency budget. Get professional results from a text description.
E-Commerce Product Promotion
Design real-estate infographics for online store banners, product launches, and seasonal sales. Conversion-focused visuals for digital retail.
AI Real-Estate Infographic Generation: Frequently Asked
Team accounts allow multiple users to share prompts, saved real-estate infographic designs, and brand kits within a shared workspace. Team members can iterate on each other's real-estate infographic designs and maintain consistent output across projects.
Common sizes include 1080x1080 for Instagram feed, 1080x1920 for stories and reels, 1200x628 for Facebook links, 1500x500 for Twitter headers, and 1080x1350 for Pinterest. Specify the platform in your prompt and Pixazo optimizes real-estate layout for that format.
The AI generates designs at the specified dimensions. For professional print production, add 'with bleed area' to your prompt to extend background elements beyond the trim line. Crop marks and registration marks should be added in your print preparation software.
Describe your core design parameters in each prompt and vary only the specific elements that should change across the series. Maintaining consistent color palette, typographic approach, and compositional structure across real-estate infographic variations creates a coherent series.
Pixazo provides an API for programmatic real-estate infographic generation. Integrate it into your content pipeline to automate design production at scale. API documentation covers authentication, prompt formatting, and output retrieval.
Pixazo generates high-resolution files suitable for both print and digital use. Specify your intended output format in your prompt. Print real-estate infographics benefit from high-DPI settings, while web and social media use works well with standard resolution output.
Avoiding Real-Estate Infographic Mistakes: Practical Guidelines
Optimize for the display medium
Tailor your real-estate infographic resolution, color space, and text size to the specific platform or physical context where it will appear.
Keep the message focused
A strong real-estate infographic communicates one primary idea clearly. Supporting details should reinforce, not compete with, the main message.
Test with real content
Never finalize a real-estate infographic with placeholder text. Real copy often has different lengths and line breaks that affect the design.
Use too many fonts
More than two or three typefaces in a single real-estate infographic creates visual noise and makes the design feel disjointed.
Forget the call to action
A real-estate infographic without a clear next step for the viewer is a missed opportunity. Always include direction on what to do next.
Ignore accessibility
Low-contrast text and tiny font sizes in your real-estate infographic exclude a significant portion of your potential audience.
Skip proofreading
Typos and grammatical errors on a real-estate infographic undermine credibility instantly. Always have someone else review the final text.
Real-Estate Infographic Maker Comparison: A Neutral Comparison
| Tool | Description |
|---|---|
| Desygner | Multi-format design tool with PDF editing and brand management |
| VistaCreate | Visual content platform with templates and a built-in asset library |
| Pixazo | AI-powered real-estate infographic generator with prompt-based design and professional output quality |
| Stencil | Lightweight image creator optimized for fast social media graphics |
| Snappa | Quick graphic creator focused on social media and marketing visuals |
Behind Real-Estate Infographic Design: Design Powers
Commercial Use Rights
Designs generated with Pixazo are yours to use commercially. No additional licensing required for real-estate infographic projects.
Print-Ready Output
Generated real-estate infographics are sized and structured for professional printing. Download high-resolution files ready for production.
No Design Software Required
Create professional real-estate infographics without Photoshop, Illustrator, or other design applications. The AI handles all technical production.
Consistency Across Variants
Generate multiple real-estate infographics for a project and maintain visual consistency across the set. Specify your core design parameters and vary secondary elements.
Real-Estate Infographic Generation: Three Easy Steps
Spell Out the Requirements
Start with a text description of your real-estate infographic concept. Specify the visual style, colors, layout direction, and key text. Detailed prompts produce more accurate real-estate infographic designs than general ones.
Compare to Your Brief
Your real-estate infographic generates immediately after submission. Evaluate the design against your requirements and refine the prompt to correct any elements that don't match your intent.
Modify the Elements
Iterate on your real-estate infographic by modifying the aspects that need work. Regenerate with a more targeted prompt until the design matches your vision. Most refinements take one or two iterations.
Pocket the Design
Download your completed real-estate infographic in the format that fits your use case. High-resolution files for print, web-optimized versions for digital, or PDF for production-ready delivery.
Real Estate Infographic Specifications
Watch: Creating Real Estate Infographic designs step by step
Real-Estate Makers: Creator Highlights
Real creators sharing their real estate designs made with Pixazo AI.
Monochromatic real-estate infographic, single hue in multiple values, typographic hierarchy creates depth without color complexity
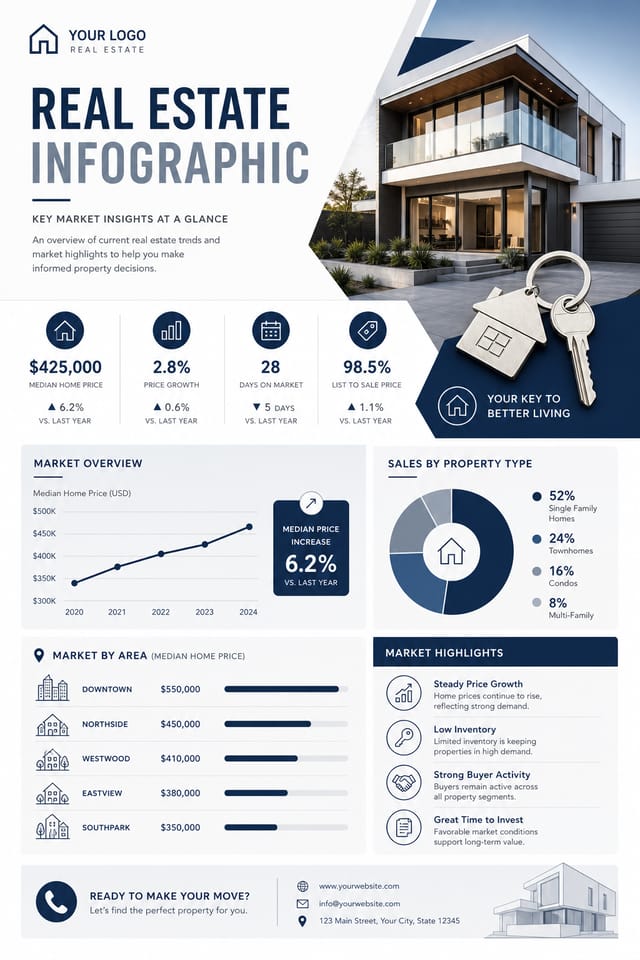
Square real-estate infographic at 1080x1080 for LinkedIn post, professional tone, balanced text-to-visual ratio, brand-safe composition
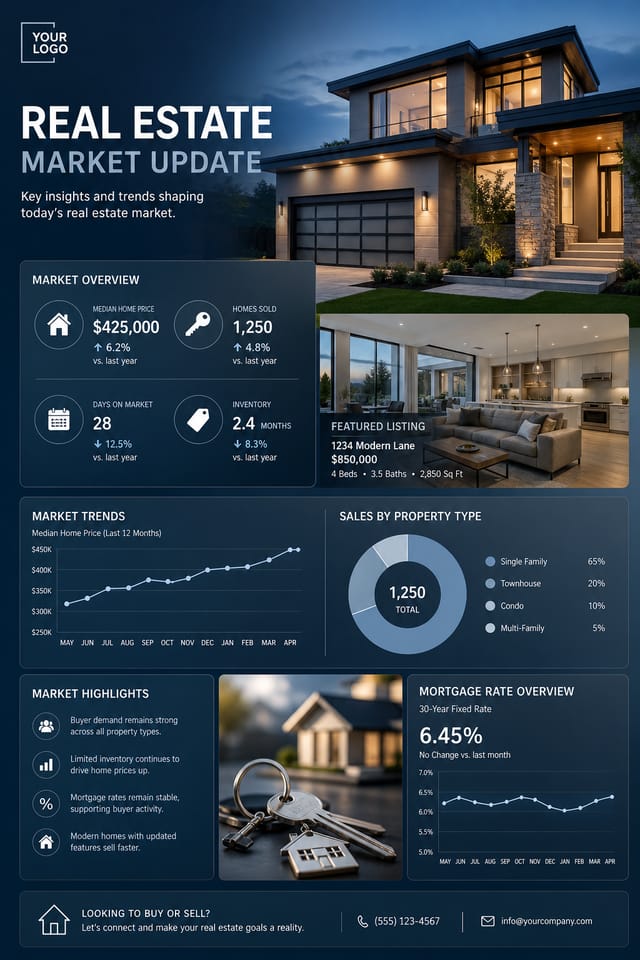
Cool palette real-estate infographic, slate and steel tones, sans-serif typography, contemporary real-estate sensibility, precise alignmentTested Real-Estate Infographic Prompt Formulas
Copy any prompt below and paste it into Pixazo to generate your design instantly.
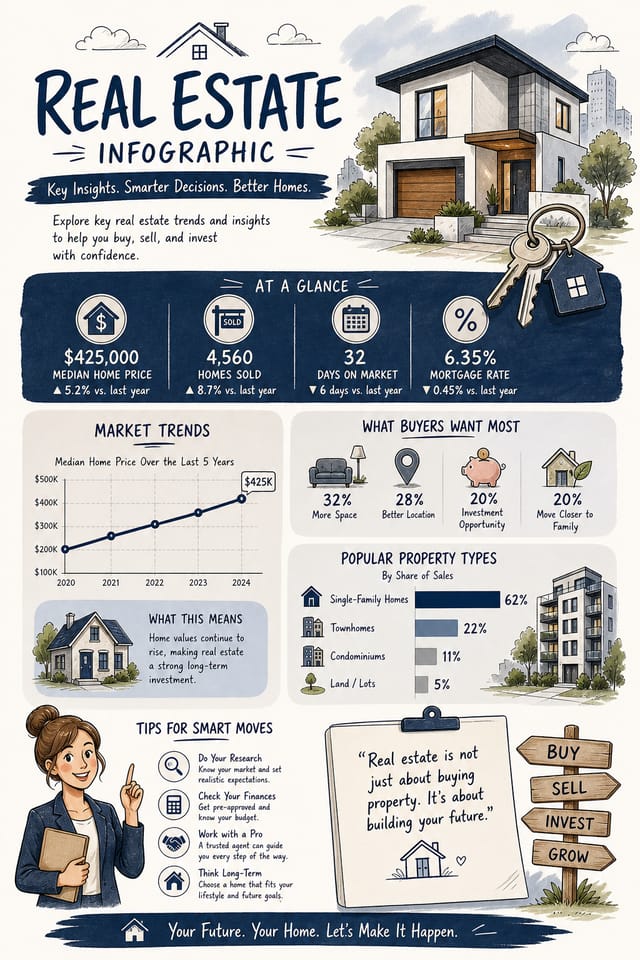
High-impact real-estate infographic, immediate visual read at thumbnail size, clear headline dominance, supporting information structured logicallyReal-Estate style infographic, bold headline placement, supporting text at appropriate scale, color palette consistent with real-estate design conventionsGeometric real-estate infographic, structured grid system, angular composition, colors in blocks rather than gradients, modern clean finishFull-bleed real-estate infographic, background treatment extends to edges, foreground elements positioned for compositional balance, strong central hierarchyTwo-color real-estate infographic design, high contrast between primary and secondary color, clean separation between graphic and text zonesLarge-format real-estate infographic design, elements sized for visibility at print scale, no fine detail that would be lost in productionBeing Realistic About Real-Estate Infographics: Areas for Improvement
Known limitations and trade-offs of AI-generated real estate design. Understanding what the AI handles well and where it falls short helps you structure your real-estate infographic design workflow effectively.

