Sports Infographic : Create Free Sports Infographics in Minutes with AI
Create Custom Sports Infographics Quickly with Pixazo Best AI Sports Infographic Maker. Try for Free!
Get Started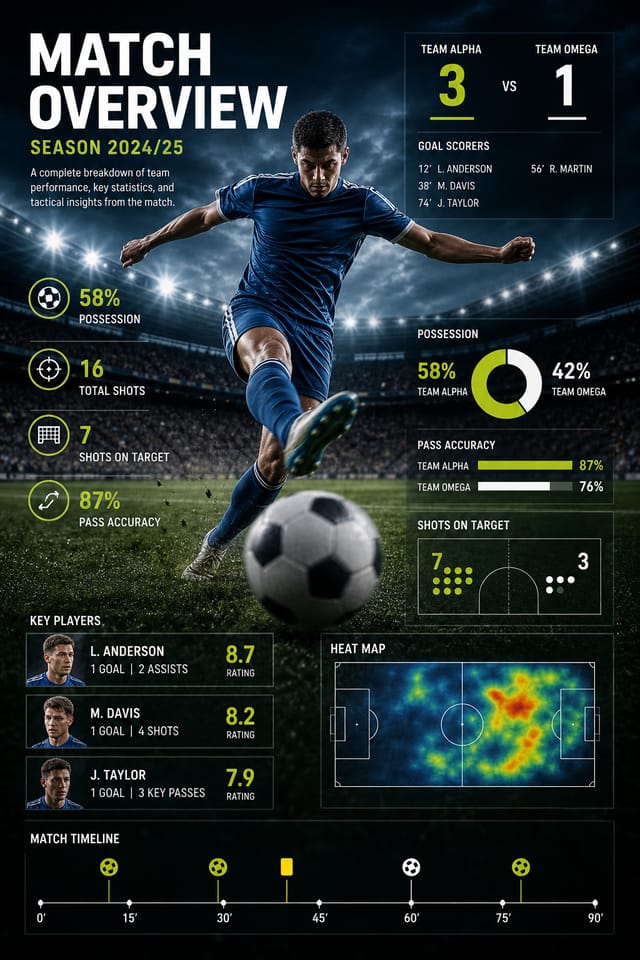
Understanding Sports Infographic Conventions: Specific Knowledge Required
The Sports Design System Pixazo Uses
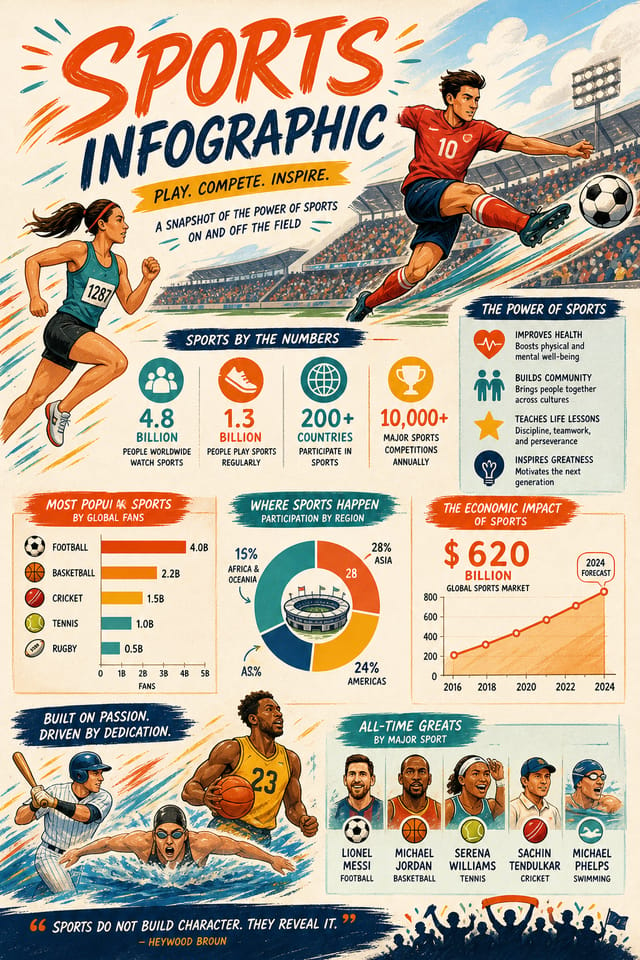
Creating a convincing sports infographic requires understanding sports as a design vocabulary, not just as a label.
The color relationships, the type choices, the spatial organization.
These elements work together to create the impression of intentional sports design.
Pixazo's generation model recognizes sports design patterns and applies them systematically.
Smart Sports Infographic Decisions: Common Pitfalls
Use a consistent visual hierarchy
Structure your sports infographic so the viewer's eye follows a clear path from headline to supporting details to call-to-action.
Keep the message focused
A strong sports infographic communicates one primary idea clearly. Supporting details should reinforce, not compete with, the main message.
Optimize for the display medium
Tailor your sports infographic resolution, color space, and text size to the specific platform or physical context where it will appear.
Test with real content
Never finalize a sports infographic with placeholder text. Real copy often has different lengths and line breaks that affect the design.
Overcrowd the layout
Filling every pixel of your sports infographic with content makes it harder to read and reduces the impact of every individual element.
Rely solely on AI output
AI-generated sports infographic designs are a starting point. Human review catches issues with context, tone, and accuracy that AI can miss.
Use too many fonts
More than two or three typefaces in a single sports infographic creates visual noise and makes the design feel disjointed.
Who Creates Sports Infographics: From Hobby to Pro
Award and Achievement Displays
Generate sports infographics celebrating player milestones, team records, and season achievements. Commemorative designs for trophy cabinets and social media.
Youth Academy Recruitment
Create sports infographics for sports academies, tryouts, and training camps. Designs that appeal to young athletes and their parents.
Watch Party Invitations
Design sports infographics for group viewing events at bars, community centers, and homes. Casual promotional materials that drive attendance.
Tournament Brackets and Schedules
Design sports infographics displaying tournament draws, league tables, and fixture schedules. Clear information hierarchy for quick reference.
Match Day Announcements
Create sports infographics that announce upcoming games, fixtures, and match schedules. Include team names, venue, and kickoff details in a design that builds anticipation.
Sports Design Community: Featured Designs
Real creators sharing their sports designs made with Pixazo AI.
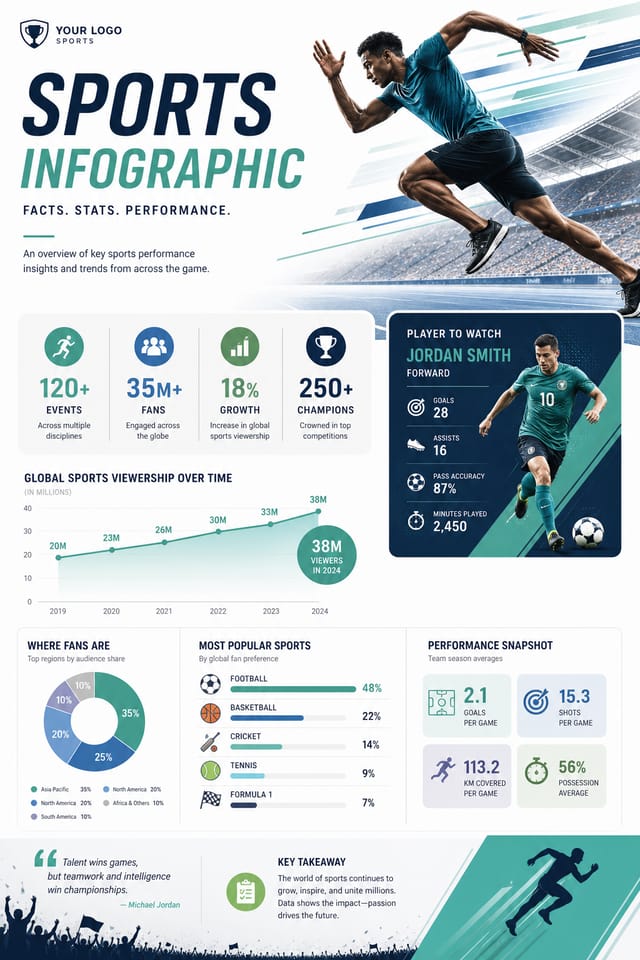
Corporate sports infographic for a B2B audience, clean and authoritative, navy and white palette, structured grid, data-friendly layout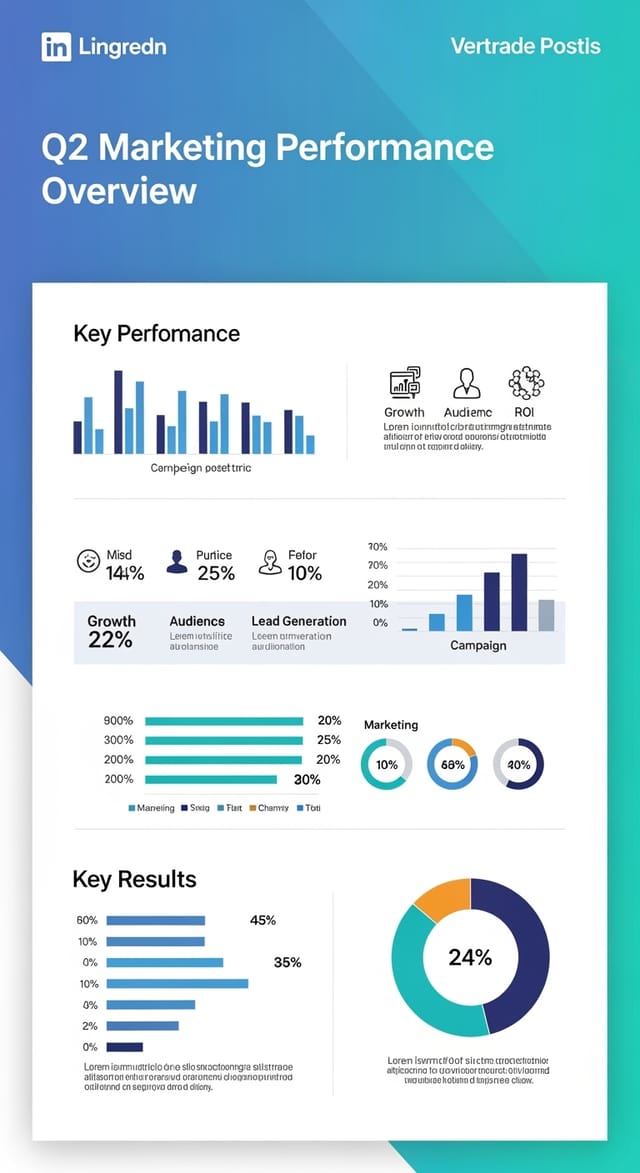
Sports infographic designed for dark mode display, OLED-optimized black background, vibrant accent colors, high contrast text
A3 landscape sports infographic for conference booth, informational layout with three columns, clear section headers, QR code placement zonePrecision Sports Infographic Tools: Core Strengths
Subcategory Awareness
The AI distinguishes between design subcategories. A sports infographic request produces sports-appropriate output, not a generic design with sports text added.
Instant Iterations
Generate multiple sports infographic variations from a single prompt. Compare options and refine until the design matches your vision.
Negative Space Handling
The AI manages whitespace in sports infographic designs according to sports aesthetic conventions, not generic poster defaults.
Layered Style Application
Combine sports style with other design parameters in a single prompt. The AI interprets complex requests and applies multiple style constraints simultaneously.
The Sports Infographic Process: The Creation Flow
Specify Your Needs
Start with a text description of your sports infographic concept. Specify the visual style, colors, layout direction, and key text. Detailed prompts produce more accurate sports infographic designs than general ones.
Probe the Output
Your sports infographic generates immediately after submission. Evaluate the design against your requirements and refine the prompt to correct any elements that don't match your intent.
Revise and Improve
Adjust your prompt to modify specific elements of the sports infographic. Change the color palette, shift typography weight, or reposition the compositional focus. Each iteration gets you closer to the final design.
Deploy to Production
Export your sports infographic in the format you need. PNG for web and social, PDF for print production, JPG for email and lightweight sharing. The file is yours to use commercially without restrictions.
Watch: Creating Sports Infographic designs step by step
What Separates Strong Sports Infographics: Design Fundamentals
Sports Infographic File Formats: Choosing the Right Format
SVG
Scalable format for sports infographic designs that need to render crisply at any resolution, commonly used for web and responsive layouts.
JPG
Compressed image format suited for sports infographic designs with photographic elements where smaller file size matters more than pixel-perfect edges.
PNG
Lossless image format ideal for sports infographic designs with transparency, sharp text, and web display at predictable file sizes.
WEBP
Modern web format offering smaller file sizes than PNG or JPG for sports infographic images without significant quality loss.
TIFF
High-fidelity format for sports infographic files destined for professional printing, supporting CMYK color and lossless compression.
Sports Infographic Constraints: Areas for Improvement
Known limitations and trade-offs of AI-generated sports design. Understanding what the AI handles well and where it falls short helps you structure your sports infographic design workflow effectively.
Sports Infographic Generation: Prompts That Work
Copy any prompt below and paste it into Pixazo to generate your design instantly.
Contemporary sports infographic design, grid-based layout, typographic precision, restrained color palette, no decorative excessSports infographic for digital display, optimized proportions for screen viewing, colors calibrated for RGB output, legible at typical viewing distanceFull-bleed sports infographic, background treatment extends to edges, foreground elements positioned for compositional balance, strong central hierarchySports infographic design, clean layout, strong typography hierarchy, appropriate color palette for sports aesthetic, high contrast between headline and backgroundMonochromatic sports infographic, single-hue palette with value variation for contrast, typographic hierarchy creates visual interest without color complexityLarge-format sports infographic design, elements sized for visibility at print scale, no fine detail that would be lost in productionYour Sports Infographic Questions: Frequently Asked
The AI generates designs at the specified dimensions. For professional print production, add 'with bleed area' to your prompt to extend background elements beyond the trim line. Crop marks and registration marks should be added in your print preparation software.
Pixazo provides an API for programmatic sports infographic generation. Integrate it into your content pipeline to automate design production at scale. API documentation covers authentication, prompt formatting, and output retrieval.
Specify the dimensions in your prompt. Common formats like A3, 18x24 inches, or 1080x1920 pixels for social media stories all work. The AI generates a sports infographic composition appropriate for the specified aspect ratio and use case.
Common sizes include 1080x1080 for Instagram feed, 1080x1920 for stories and reels, 1200x628 for Facebook links, 1500x500 for Twitter headers, and 1080x1350 for Pinterest. Specify the platform in your prompt and Pixazo optimizes sports layout for that format.

